

After the UN Sustainable Development Solutions Network unveiled its Action Agenda for Sustainable Development in June 2013, suggesting ten operational priorities for the post-2015 development agenda and proposing 10 goals (the so-called Sustainable Development Goals, or SDGs) with 30 associated targets to replace the expiring Millennium Development Goals (MDGs) , intensive work has been conducted by the 12 Thematic Groups in order to identify proper indicators to help monitor and assess progress in the implementation of those goals. The result of this process is Indicators for SDGs, a new draft report which “presents an integrated framework of 100 indicators within the framework of the goals and targets proposed by the SDSN”. Public consultation has been encouraged at all levels to improve the draft version, and the deadline for submitting comments extended to March 28, 2014. You can find the draft report here (but also tweet about it using #indicators2015).
In this broader context, University of Siena has decided to take part in the discussion, drawing up a document of suggestions and observations aimed at integrating the SDSN report, to which professors and researchers within the Ne.S.So. board all contributed according to their respective areas of interest, and to which I also participated with a set of proposals focused on possible indicators for Goal 9 (Secure Ecosystem Services and Biodiversity, and Ensure Good Management of Water, Oceans, Forests and Natural Resources). The comments I wrote were included with some modifications and cuts in the submitted form, as a result of the excellent assembly work completed by Prof. Simone Bastianoni and his group (Ecodynamics); nonetheless, I am pleased to share an extended version of my personal contribution (one that includes some background and a few explanations on the points made), as we all wait for the final version of ‘Indicators for SDGs’ which will hopefully take our proposals into account. Don’t forget, I look forward to hear from you about it.
1. Goal 9 of the SDGs
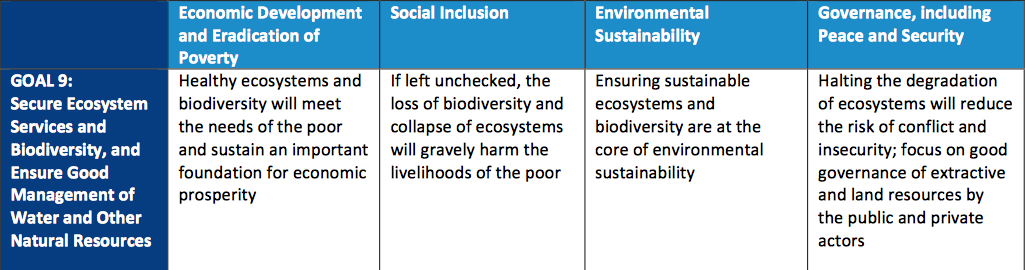
Within the proposed Sustainable Development Goals and Targets, Goal 9 is concerned with “securing ecosystem services and biodiversity, and ensuring good management of water, oceans, forest and natural resources”. If pursued effectively, this goal basically requires that “biodiversity, marine and terrestrial ecosystems of local, regional, and global significance are inventoried, managed, and monitored to ensure the continuation of resilient and adaptive life support systems and to support sustainable development”, in accordance with the Aichi Biodiversity targets. At the same time, it implies that “water and other natural resources are managed sustainably and transparently to support inclusive economic and human development”1.
Goal 9 is also partitioned in 3 separate but interconnected targets:
– Target 9a) Ensure resilient and productive ecosystems by adopting policies and legislation that address drivers of ecosystem degradation, and requiring individuals, businesses and governments to pay the social cost of pollution and use of environmental services.*
– Target 9b) Participate in and support regional and global arrangements to inventory, monitor, and protect biomes and environmental commons of regional and global significance and curb trans-boundary environmental harms, with robust systems in place no later than 2020.
– Target 9c) All governments and businesses commit to the sustainable, integrated, and transparent management of water, agricultural land, forests, fisheries, mining, and hydrocarbon resources to support inclusive economic development and the achievement of all SDGs.*
As stressed by the Action Agenda for Sustainable Development, a specific goal devoted to the protection of biodiversity and ecosystem services it provides is justified by the fact that “ecosystems, such as rainforests, mangroves, coral reefs, wetlands, drylands, and grasslands underpin human life on Earth, through provisioning services (e.g. food, clean water, energy, medicines), regulating services (e.g. climate, air quality, pollination, coastal storm protection), support services (e.g. soil formation), and cultural services (e.g. educational, religious, tourism)”2, 3. Today, such ecosystems are almost everywhere experiencing processes of heavy degradation, caused by pollution, eutrophication, climate change, overharvesting of resources and so on, while biodiversity loss is occurring at an unprecedented rate in the history of life on earth; a profound modification in the management and governance of the way mankind interacts with these support systems is thus needed to ensure sustainable development challenges are met throughout the four traditional dimensions of this concept (see fig.1).
However, it is not to be forgotten that substantial linkages exist between Goal 9 and the other SDGs, and especially Goal 6 (Improve Agriculture Systems and Raise Rural Prosperity), Goal 7 (Empower Inclusive, Productive and Resilient Cities) and Goal 8 (Curb Human-Induced Climate Change and Ensure Sustainable Energy), which will also have to be put into action in order to achieve development within planetary boundaries and fully secure biodiversity and ecosystems, as a consequence. This is something I consider in my comments (see infra).
2. Indicators for Goal 94
The SDSN draft report on the indicators for the post-2015 development agenda proposes, inter alia, the following indicators:
– for Target 9a: Ocean Health Index at the national level (more info here), Red List Index by country and major species group (here), Protected Areas Overlays with Biodiversity (here), Area of Forest Under Sustainable Forest Management as a Percent of Forest Area (here). More indicators that apply to Target 9a are covered under other Targets, i.e. Annual change in forest area and land under cultivation (Target 6b), while additional tools are left for countries to consider, such as with regard to the implementation of spatial planning strategies for coastal and marine areas or the use of destructive fishing techniques.
– for Target 9b: Ocean Health Index at the regional level, Red List Index for internationally traded species, Proportion of Fish Stocks Within Safe Biological Limits (see here), Protected Area Overlays with Biodiversity (regional and global); additional indicators for countries may include Abundance of Invasive Alien Species and Area of Coral Reef Ecosystems and Percentage Live Cover.
– for Target 9c: Proportion of Total Water Resources Used, Publication of Resource-Based Contracts, Access to Land in Rural Areas, Publication of All Payments Made to Governments Under Resource Contracts; additional indicators may include Improved Land Ownership and Governance of Forests.
As my main areas of interest currently lie within the Targets 9a-b, my observations are mostly concerned with indicators provided for those two.
3. Comments on Goal 9
3.1 Factoring habitat loss in
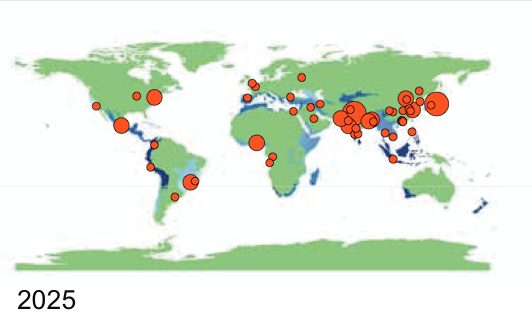
Habitat loss, mostly caused by agricultural expansion, urbanization and infrastructure development, today accounts for the primary cause of species extinction and thus of biodiversity loss5. In order to secure ecosystem services it is then vital to simultaneously track down the drivers of habitat destruction; while Target 6b already provides for and indicator of the Annual Change in Forest Area and Land Under Cultivation, there is no mention in the report of the need to monitor urban expansion and other infrastructure development, with the former “occurring fast in areas adjacent to biodiversity hotspot and faster in low-elevation, biodiversity-rich coastal zones than in other areas”6, with more than 60 percent of the area projected to be urban in 2030 that has yet to be built7 and the latter also representing a foremost threat for habitats, migratory species and genetic diversity.
Such an indicator (i.e. Annual Change in Wild and/or Protected Habitats and Land Under Urban and Infrastructure Development) could be made object of disaggregation at the regional and national level to better cope with different geographical and demographic contexts (i.e. infrastructure development in developing countries might in some cases call for a specific attention to balancing human rights such as access to electricity, water supplies, sanitation etc. and conservation considerations).
3.2 Fighting Wildlife Crime to Protect Biodiversity
The goal of securing ecosystem services through the adoption of policies that address drivers of ecosystem degradation could require a parallel commitmment to protect biodiversity and wildlife per se, in order to be fully effective. Today, wildlife crime within the international trade of endangered species still represents one of the key drivers of biodiversity loss, as does legal overharvesting, with the two respectively believed to be worth $160bn and from $10 to 20bn dollars in 20108; adopting the Red List Index as an indicator, while necessary to monitor the species’ biological status, does not monitor the implementation of policies to safeguard or improve that same status as well.
The development of specific indicators could then provide a direct measure of the level of compliance that exists within the international community: as a suggestion, they might include the Volume of Funds (in the forms of international aid, fraction of national budget, or support provided for IGOs such as INTERPOL) utilized by governments to fight wildlife crime and implement international policies, the Annual Variation in Seizures of illegal biological material and the Number of Reported Cases of IUU Fishing in the High-Seas. In addition, as biodiversity hotspots in developing countries are often threatened by armed conflicts9, Goal 9 could ‘borrow’ the symmetrical indicator presented for Goal 1 (Refugees and internal displacement caused by conflict and violence) in the form of an indicator that measures Populations Negatively Affected by Civil War and other forms of violence.
3.3. Assessing environmental change on a warming planet
The contribution of climate change to biodiversity loss and ecosystem degradation is a matter of primary importance10, expected to threaten with extinction approximately one quarter or more of all species on land by the year 205011, yet almost impossible to quantify effectively, especially at the global level and on a limited timescale. Nonetheless, at the regional and national level, where impacts of warmer temperatures, changes in precipitation patterns etc. are usually heavily studied and monitored, the development of specific indicators could help better assess the relation between those two issues and determine the extent to which ecosystems get modified overtime.
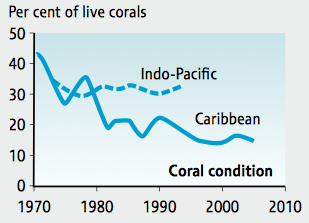
As a suggestion, Shifts in Species Range and/or Trophic Level (with a special focus on keystone species and, in general, on target species for which higher-quality data and assessment methods exist) caused by modifications endured by the food web or by other forms of environmental change attributable to climatic variations (i.e. coral bleaching events, widespread mortality, effects upon shell-forming organisms12) alone or in conjunction with other drivers, could provide the basis for such and indicator13.
3.4. Monitoring sustainability in global fisheries
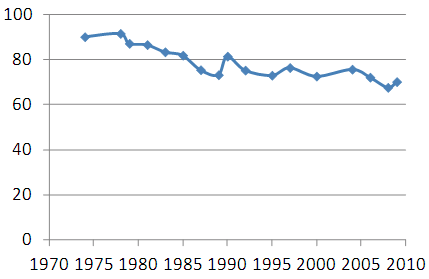
Indicator 83, which refers to the Proportion of Fish Stocks that are Within Safe Biological Limits, could be integrated through an evaluation of the Proportion of Fish Captures (out of the amount of total catches) that come from Sustainably Managed Stocks and/or Stocks that are Within Safe Biological Limits, to monitor the impact of sustainable practices/fisheries on global fisheries production (and not just biological status by itself). Additional indicators on the subject could include the Temporal Variation in Capacity-Enhancing Subsidies (that is, public subsidies of all forms that enhance vessels’ capacity to catch fish) destined to the fisheries sector, which amounted to 20bn dollars in 200914, a measurement of the Decline of Keystone Species caused by overfishing (also a cause of ecosystems degradation) and the Proportion of Seafood Converted into Fishmeal for Aquaculture out of global catches. The last indicator could be particularly needed in the future, as the worldwide increase in the production of carnivorous species has determined an increased use of fishmeal, fish oil and low-value fish in aquaculture15 which in turn results in increased pressure on targeted stocks and entails a net-loss in the amount of seafood available for human consumption.
It is to be noted that the portion of capture fisheries used to produce fishmeal will be about 17 percent by 202116, declining by 6 percent compared with the 2009–2011 average owing to the growing demand for fish for human consumption. However, in 2021 fishmeal production should be 15 percent higher compared with the 2009–2011 average16 (though almost 87 percent of the increase will derive from improved use of fish waste), a rise which causes further concerns on the sustainability of a supply chain that is already facing a dramatic decline of global fish stocks.
*****
On March 14, Thematic Group 8 of the SDSN (Forests, Oceans, Biodiversity, and Ecosystem Services) has launched a public consultation on its first draft report. The deadline has been set for April 14; you can find out more and read the current version here.
_______________
* Targets marked need to be specified at country or sub-national level
1 SDSN Leadership Council (2013) An Action Agenda for Sustainable Development; p.31
2 SDSN Leadership Council, ibid.; p.21
3 See the Millennium Ecosystem Assessment for more details
4 SDSN Leadership Council (2014) Indicators for SDGs draft report; pp. 110-121
5 Millennium Ecosystem Assessment (2005) Ecosystems and Human Well Being: The Biodiversity Synthesis (World Resources Institute, Washington DC); p.10
6 Elmqvist et al. (eds.) (2013) Urbanization, Biodiversity and Ecosystem Services: Challenges and Opportunities: A Global Assessment; p.2
7 Elmqvist et al. (eds.) (2013) ibid.; p.410
8 cited by Gillespie (2011) Conservation, Biodiversity and International Law (Edward Elgar Publishing Ltd.); p.196
9 Hanson et al. (2009) Warfare in Biodiversity Hotspots (Conservation Biology. Vol 23, Issue 3); pp.578-587
10 for a general overview see CBD (2010) Global Biodiversity Outlook 3; pp.8-13
11 Malcolm et al. (2006) Global Warming and Extinctions of Endemic Species from Biodiversity Hotspots (Conserv Biol. Vol 20, Issue 2); pp.538–548
12 IPCC (2007) Climate Change 2007: Impacts, Adaptation and Vulnerability (Cambridge University Press)
13 For an example of linkages between climate change and alteration in the food web, see Bond and Lavers (2014) Climate change alters the trophic niche of a declining apex marine predator (Glob Change Biol, unedited)
14 Sumaila et al. (2010) A bottom-up re-estimation of global fisheries subsidies (Journal of Bioeconomics 12); pp.201-225
15 Rana et al. (2009) Impact of rising feed prices on aquafeeds and aquaculture production (FAO Fisheries and Aquaculture Technical Paper No. 541. Rome, FAO)
16 FAO (2012) The State of World Fisheries and Aquaculture 2012; p.189

One thought on “Comments on Goal 9 of the UNSDSN draft report Indicators for SDGs”